“Everything is related to everything else, but near things are more related than distant things“, Tobler
About Me
Welcome to my blog, dedicated to sharing and discussing regional development. Here, you will find diverse posts of project showcases, tutorials, and insights rooted in economic development and regional science.
I am a doctoral student in the Economic Development Policy and Management Program at the Graduate School of International Development (GSID), Nagoya University, Japan. My current research uses satellite, meso, and microdata, combining remote sensing, causal inference, and a spatial econometrics approach to study rural and regional development in Indonesia. I completed my Master’s in Development Economics at Diponegoro University in Semarang, Indonesia. In 2014, I joined the Institute for Development of Economics and Finance (INDEF; www.indef.or.id), a think tank based in Jakarta, Indonesia.
Currently, I am doing my PhD project under the supervision of
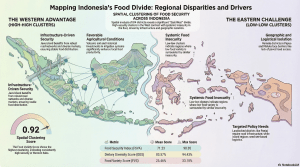
I am delighted to share my first job-market paper, Mapping Food Security in Indonesia: Geographic Clusters and Regional Disparities, published in the Indonesian Journal of Geography, Vol. 57, No. 3 (2025). Link PDF Poster summary of the paper Here is the summary of the paper A recent study reveals a sharp contrast in how different regions of Indonesia access food. The paper analysed data from 514 districts to understand the… Read more: Mapping Food Security in Indonesia: Geographic Clusters and Regional Disparities
In spatial econometrics, before we run the model, we need to compute descriptive statistics, as in the non-spatial econometrics approach. In spatial econometrics, there is an extension beyond describing data (mean, maximum, minimum, and standard deviation). It is called Exploratory Spatial Data Analysis (ESDA) and uses map visualisation to identify patterns. Also, we need to assess spatial autocorrelation using Global Moran’s I and the presence of local clusters. The formula… Read more: Exploratory Spatial Data Analysis: STATA Application (1)
I updated the map using Github to host the HTML file map. This chart shows the LISA scatter of poverty in Central Java Province, Indonesia, in 2022. The four quadrants represent the High-High, High-Low, Low-High, and Low-Low poverty clusters. Using the weight queen matrix, four regions are included in the high-high poverty cluster in Central Java in 2022: Kebumen (my hometown), Banyumas, Wonosobo, and Purworejo. I also added a map… Read more: LISA Map Poverty of Central Java- Indonesia, 2022
Jumlah pemudik pada lebaran 2025 turun dibandingkan dengan lebaran 2024. Hal ini didasarkan pada survei oleh Kementerian Perhubungan yang menyatakan jumlah pemudik tahun ini diperkirakan mencapai 146,48 juta orang, turun sekitar 24% dari 193,6 juta orang pada tahun sebelumnya. Penurunan yang cukup besar ini berpengaruh terhadap mobilitas armada di tujuan mudik yang pada akhirnya bisa menurunkan emisi dari penggunaan kendaraan. Untuk mengetahui penurunan mobilitas atau jumlah kendaraaan yang melakukan mudik dan beraktifivitas… Read more: Melihat Perkembangan Arus Mudik Melalui Emisi
Postingan ini merupakan postingan awal untuk seri analisis Spasial dengan GeoDa. Pada tulisan kali ini, saya ingin membagikan tautan bagaimana mendownload GeoDa, khususnya untuk pengguna Windows. Softaware GeoDa merupakan software analisis spasial yang menggunakan user interface (mengutamakan penggunaan mouse untuk menjalankan softwarenya). Hal ini berbeda dengan Stata, R, atau Python yang mengutamakan coding. Dengan demikian, GeoDa menjadi alternatif bagi peneliti yang kesulitan untuk menjalakan program menggunakan coding. Berikut link tutorial… Read more: Analisis Spasial dengan GeoDa : Download GeoDa

 I am delighted to share my first job-market paper, Mapping Food Security in Indonesia: Geographic Clusters and Regional Disparities, published in the Indonesian Journal of Geography, Vol. 57, No. 3 (2025). Link PDF Poster summary of the paper Here is the summary of the paper A recent study reveals a sharp contrast in how different regions of Indonesia access food. The paper analysed data from 514 districts to understand the… Read more: Mapping Food Security in Indonesia: Geographic Clusters and Regional Disparities
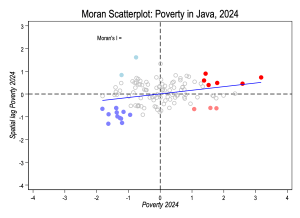 In spatial econometrics, before we run the model, we need to compute descriptive statistics, as in the non-spatial econometrics approach. In spatial econometrics, there is an extension beyond describing data (mean, maximum, minimum, and standard deviation). It is called Exploratory Spatial Data Analysis (ESDA) and uses map visualisation to identify patterns. Also, we need to assess spatial autocorrelation using Global Moran’s I and the presence of local clusters. The formula… Read more: Exploratory Spatial Data Analysis: STATA Application (1)
 I updated the map using Github to host the HTML file map. This chart shows the LISA scatter of poverty in Central Java Province, Indonesia, in 2022. The four quadrants represent the High-High, High-Low, Low-High, and Low-Low poverty clusters. Using the weight queen matrix, four regions are included in the high-high poverty cluster in Central Java in 2022: Kebumen (my hometown), Banyumas, Wonosobo, and Purworejo. I also added a map… Read more: LISA Map Poverty of Central Java- Indonesia, 2022
 Jumlah pemudik pada lebaran 2025 turun dibandingkan dengan lebaran 2024. Hal ini didasarkan pada survei oleh Kementerian Perhubungan yang menyatakan jumlah pemudik tahun ini diperkirakan mencapai 146,48 juta orang, turun sekitar 24% dari 193,6 juta orang pada tahun sebelumnya. Penurunan yang cukup besar ini berpengaruh terhadap mobilitas armada di tujuan mudik yang pada akhirnya bisa menurunkan emisi dari penggunaan kendaraan. Untuk mengetahui penurunan mobilitas atau jumlah kendaraaan yang melakukan mudik dan beraktifivitas… Read more: Melihat Perkembangan Arus Mudik Melalui Emisi
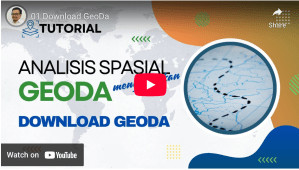 Postingan ini merupakan postingan awal untuk seri analisis Spasial dengan GeoDa. Pada tulisan kali ini, saya ingin membagikan tautan bagaimana mendownload GeoDa, khususnya untuk pengguna Windows. Softaware GeoDa merupakan software analisis spasial yang menggunakan user interface (mengutamakan penggunaan mouse untuk menjalankan softwarenya). Hal ini berbeda dengan Stata, R, atau Python yang mengutamakan coding. Dengan demikian, GeoDa menjadi alternatif bagi peneliti yang kesulitan untuk menjalakan program menggunakan coding. Berikut link tutorial… Read more: Analisis Spasial dengan GeoDa : Download GeoDa